how we help
Insurers
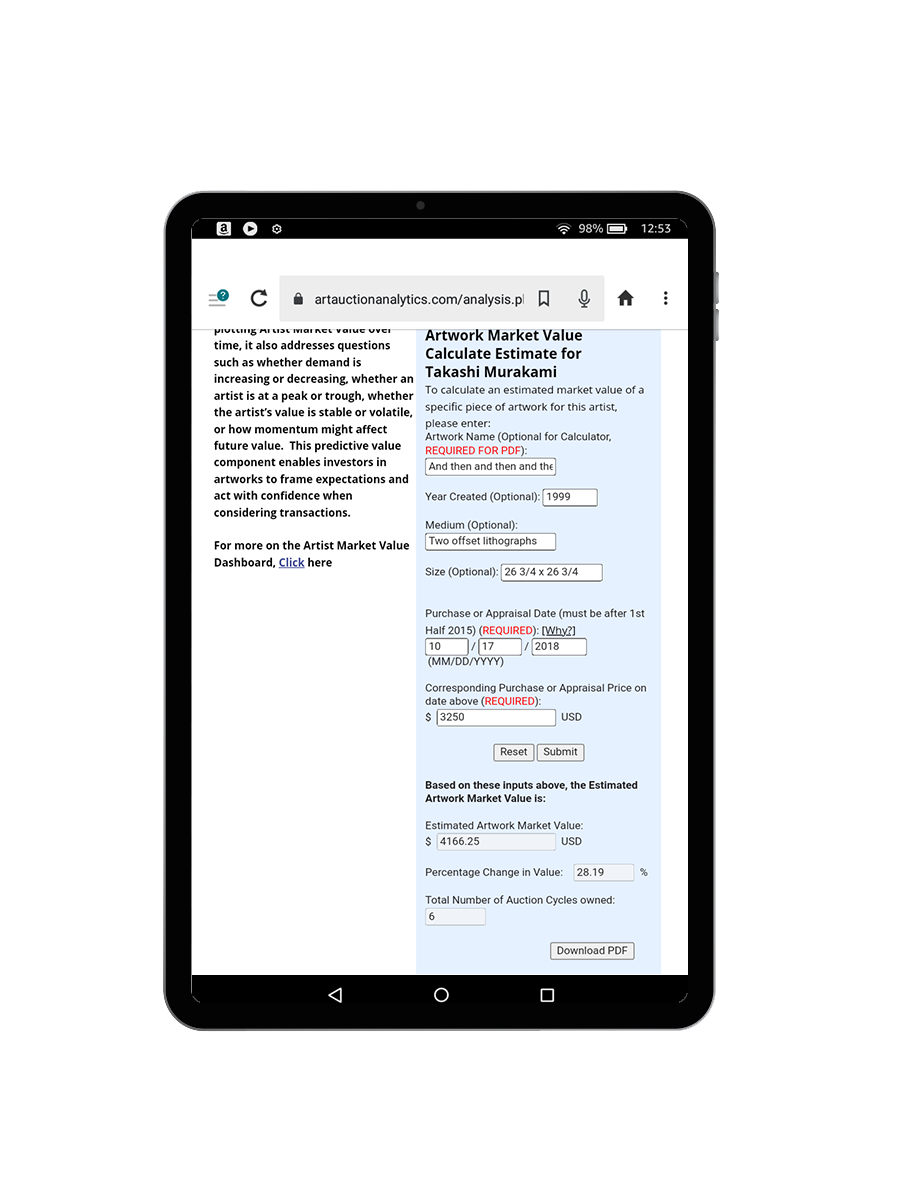
- Access the Artwork Market Value to identify how much an artwork or collection should be insured for;
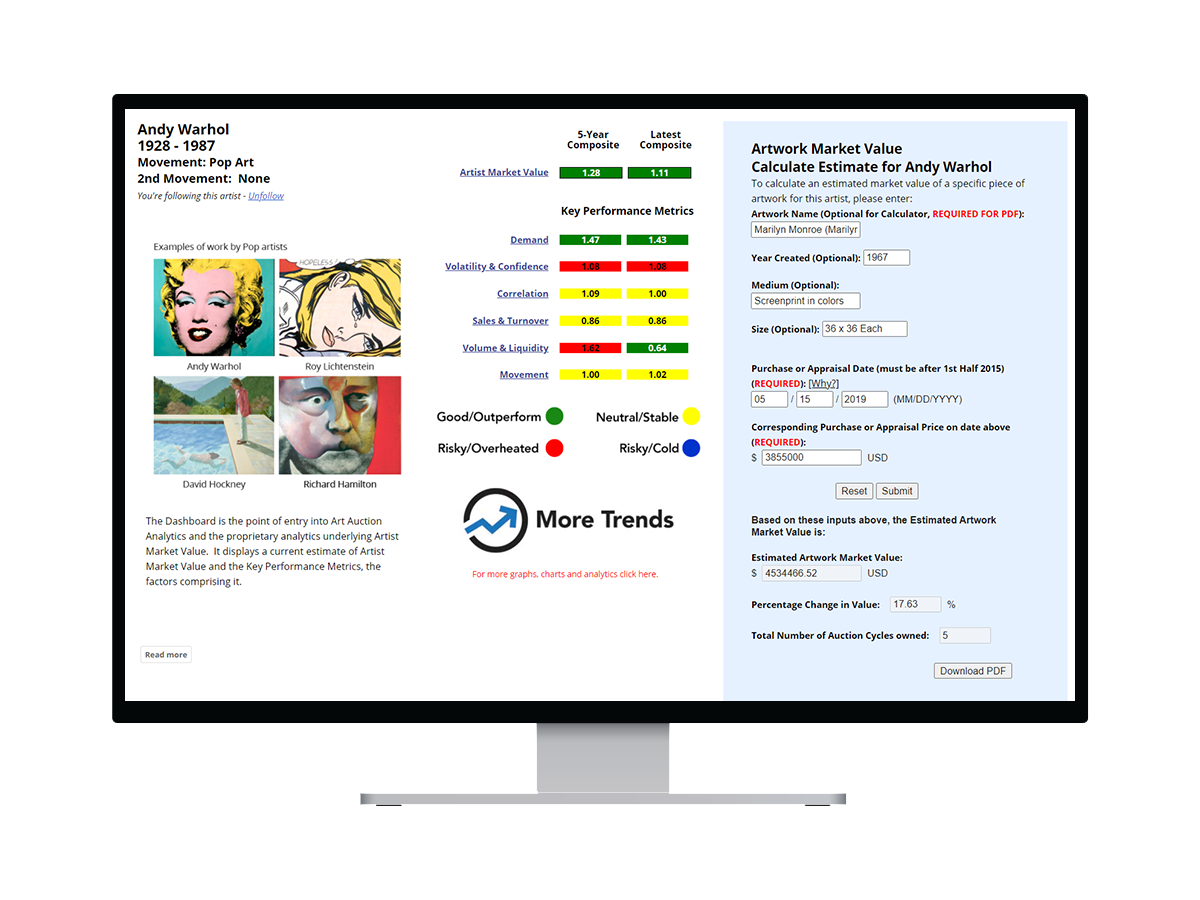
- Monitor the Artwork Market Value, AMV, and KPMs for downside risk; and
- Use the Artwork Market Value to establish a fair market value at the time of a claim.
overview
Strengthen Your Underwriting Processes for Insuring Art
Bolster your due diligence, underwriting, and monitoring processes for insuring artworks with our objective, transparent, and comprehensive valuation platform. Art Auction Analytics is specially built to be used through the lifecycle of an insurance transaction, from the early stages of underwriting a policy to when a potential claim may be made:
- Use the Artwork Market Value tool to calculate how much an artwork should be insured for;
- Access the accompanying AMVs and our suite of KPMs to analyze changes in Artwork Market Value or to assess downside risk; and
- Use the Artwork Market Value to establish a fair market value at the time of a claim.
Our comprehensive metrics ensure that every decision is supported by a detailed level of data. Whether you are an insurance broker or underwriter, you can rely on our objective, transparent, market-based values for your business needs.


Access Artwork Market Value = Fair Market Value
Artwork Market Value is the equivalent of establishing the fair market value of an artwork, what one would expect an artist’s artworks to sell for in the market today. Insurers can use our Artwork Market Value tool to obtain the fair market value of an artwork purchased or appraised within the last five years, by providing a quote and determining the value at the time of a claim.
Monitor Artwork Values for Downside Risk
Once a policy has been executed, Art Auction Analytics allows you to monitor the value of artists and artworks in-house to identify any changes in value. With data updated monthly, you can take advantage of our core Artwork Market Value tool, which means you do not have to:
- Wait for third-party appraisals;
- Confirm the source of these appraisals; or
- Pass through the costs of appraisals to clients.
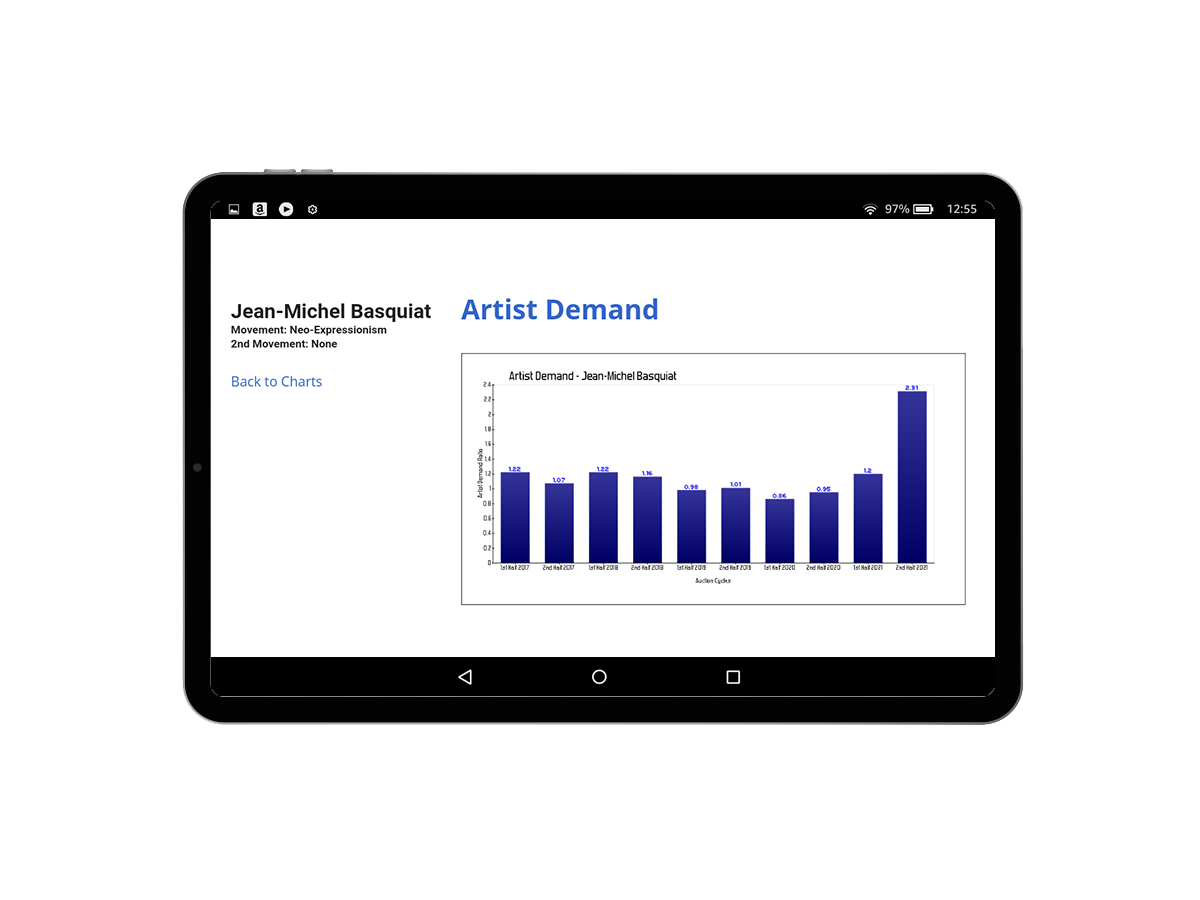
Once a change in value has been identified and may pose a downside risk, drill down into what is driving that value change. Art Auction Analytics’ extensive suite of metrics includes 20+ performance charts with five years of historical AMV and KPM metrics. Use our platform to access these metrics to analyze what is driving performance, and to spot risks.


Assess Downside Risk
We recognize that insuring art presents a number of risks to Insurers, including:
- A change in the market value of the artworks, which is not captured in the associated policy; or
- A client submits fraudulent values for the artworks underlying the policy.
Both of these risks can apply to the different policy structures insurers use for art, whether a policy that has a fixed fair market price established at the time of execution, or a policy that allows for the fair market price to be updated at the time of a claim.
Art Auction Analytics’ platform was built to help Insurers get out in front of these risks:
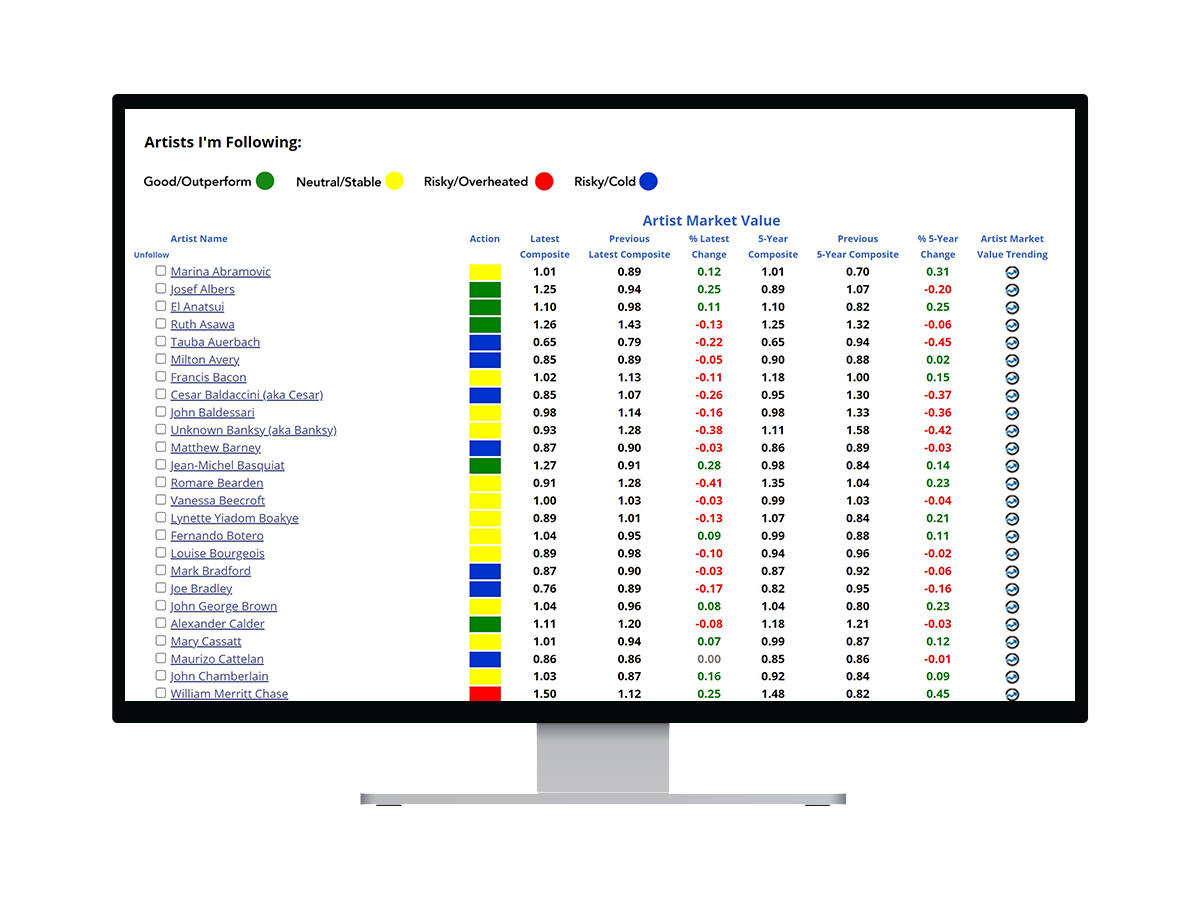
- Use our AMV and KPM trending data to determine if the risk is temporary or has the probability to be long-term; and
- Use the Artwork Market Value tool to calculate the new fair market value and to make an update to the associated policy.
Optimally Calibrate a Policy to Market Realities
Keep your pulse on the market and the means to let a client know if an artwork has changed in value, and how this affects their policy.
The Artwork Market Value tool allows you to calculate the value of an artwork, and quickly communicate to your management and client if the amount of coverage is sufficient, and whether or not your pricing is at the right level.

reportable outputs
Comprehensive Metrics that Meet Underwriting Standards
Art Auction Analytics’ comprehensive metrics enhance your underwriting standards. The platform includes current market valuations supported by a significant amount of easy-to-understand information, including:
- AMV and KPMs backed by readily available metrics and historical data.
- AMV and KPM trending information that provides additional insights into risks.
- Drill down analytics on the underlying data used to calculate each KPM.
